Trader and market analyst Peter Brandt has provided valuable perspectives on the recent price movement of Solana (SOL), suggesting the completion of a notable chart pattern.
In particular, Brandt has noted a descending triangle pattern forming on Solana’s 4-hour price chart.
Identified Chart Pattern On SOL And Its Implications
The descending triangle pattern identified by lower highs and a horizontal support line is often interpreted in technical analysis as a signal of a potential downtrend continuation. Brandt’s recent post highlighted the completion of this pattern, drawing attention to a crucial development for SOL traders.
Brandt’s analysis extends beyond the mere identification of the pattern. He underscores the significance of pattern validation over its completion.
According to Brandt, a pattern’s failure to fulfill its expected role carries more weight than its mere completion.
With the descending triangle pattern now confirmed for SOL, market participants’ anticipation is palpable as they await potential price movements, whether to the upside or downside.
A descending triangle has been completed in $SOL
I am only the messenger, not the message
Remember, a pattern failure (to do what it is supposed to do under classical rules) is more important than a pattern completion pic.twitter.com/ezershgA5A— Peter Brandt (@PeterLBrandt) April 10, 2024
Solana Network Challenges Amidst Price Fluctuations
While Solana’s price performance has fluctuated over the past week, recent network challenges have added another layer of complexity to the asset’s situation. Despite a 12.7% decline in SOL’s value over the past week, there has been a slight uptick of 4% in the last 24 hours.

However, ongoing network congestion has presented obstacles. Solana developers are actively addressing these issues, with efforts underway to resolve network congestion experienced on April 15.
Mert Mumtaz, CEO of Helius Labs, a key contributor to Solana’s maintenance and enhancement, clarified that the current network challenges stem from implementing a specific protocol rather than an inherent design flaw in Solana.
solana’s current issue is not a design flaw, it’s an implementation bug
it is now hitting me that some folks might not understand what we’ve been trying to say by this for the past week
I’ll simplify it (intended for non-technical people)
it is important to make this… pic.twitter.com/fNZzu9f90S
— mert | helius.dev (@0xMert_) April 8, 2024
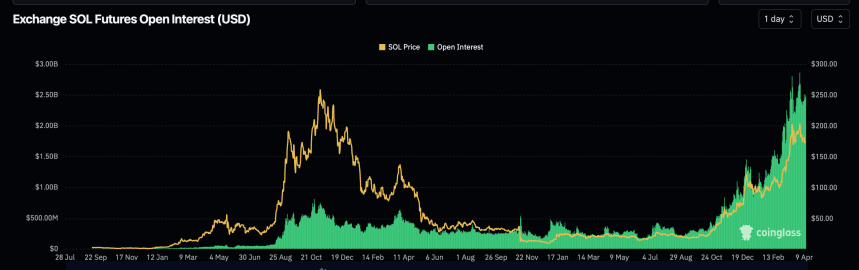
Meanwhile, Solana’s open interest in the futures sector, a metric used in derivatives markets referring to the total number of outstanding contracts, has experienced fluctuations in recent times.
While it saw steady growth from January to April, reaching an all-time high of $2.86 billion on April 1, recent network issues have led to a decline. Coinglass data indicates that Solana’s open interest has fallen to $2.4 billion since April 11, reflecting a 5% decline in just over a week.
Featured image from Unsplash, Chart from TradingView


