Journalist
Posted:
Disclaimer: The information presented does not constitute financial, investment, trading, or other types of advice and is solely the writer’s opinion.
- Celestia bulls were forced to retreat from the $7 zone as bears appeared to seize the upper hand.
- A retracement and consolidation could be underway, and key support levels to watch were highlighted.
Celestia [TIA] reached a high of $7.42 on 18th November. In a recent technical analysis piece, AMBCrypto noted that the $7.72 level was a bullish target where holders could secure profits based on Fibonacci extension levels.
However, the move ended at $7.42 and began to trend downward in the lower timeframes.
Another report from AMBCrypto had shown that active accounts and transaction count were on the drop even as prices rallied higher. This was an early sign that the bears could begin to take control of the market.
What does TIA’s move below $6 mean, and should you liquidate your holdings?
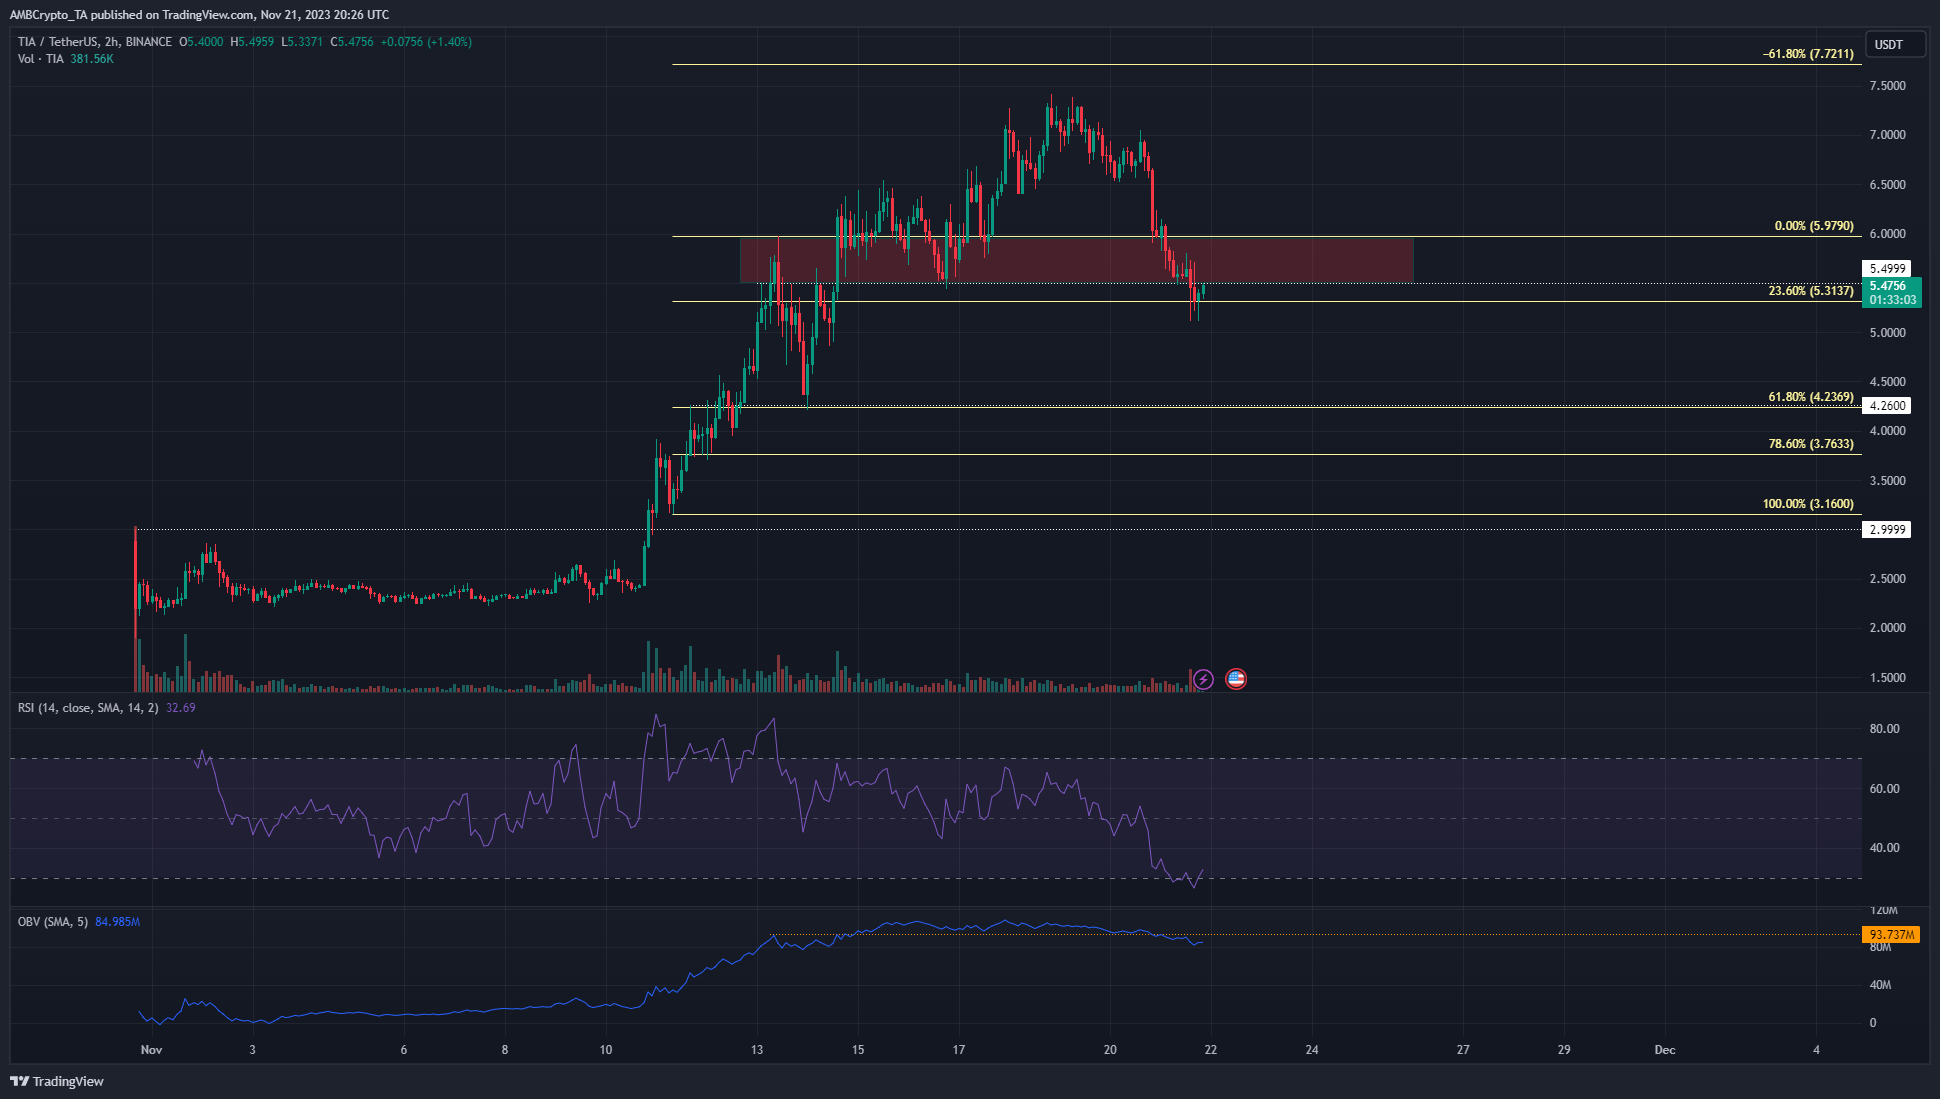
Source: TIA/USDT on TradingView
TIA saw an explosive move in November. The raging bullish sentiment of the past ten days saw TIA climb from $2.25 to $7.42, representing a 230% gain from bottom to peak. The good times could be at an end, at least over the next week.
The 2-hour price chart showed TIA has a bearish market structure. This was coupled with an RSI drop well below the neutral 50 mark over the past 24 hours. The On-Balance Volume (OBV) had formed a local support level as highlighted on the indicator.
The selling pressure saw the OBV dip below this support and was another sign that the bears were dominant at press time. To the south, the $4.88 and $4.26 levels were expected to serve as support.
The market sentiment was in favor of the bears in the short-term
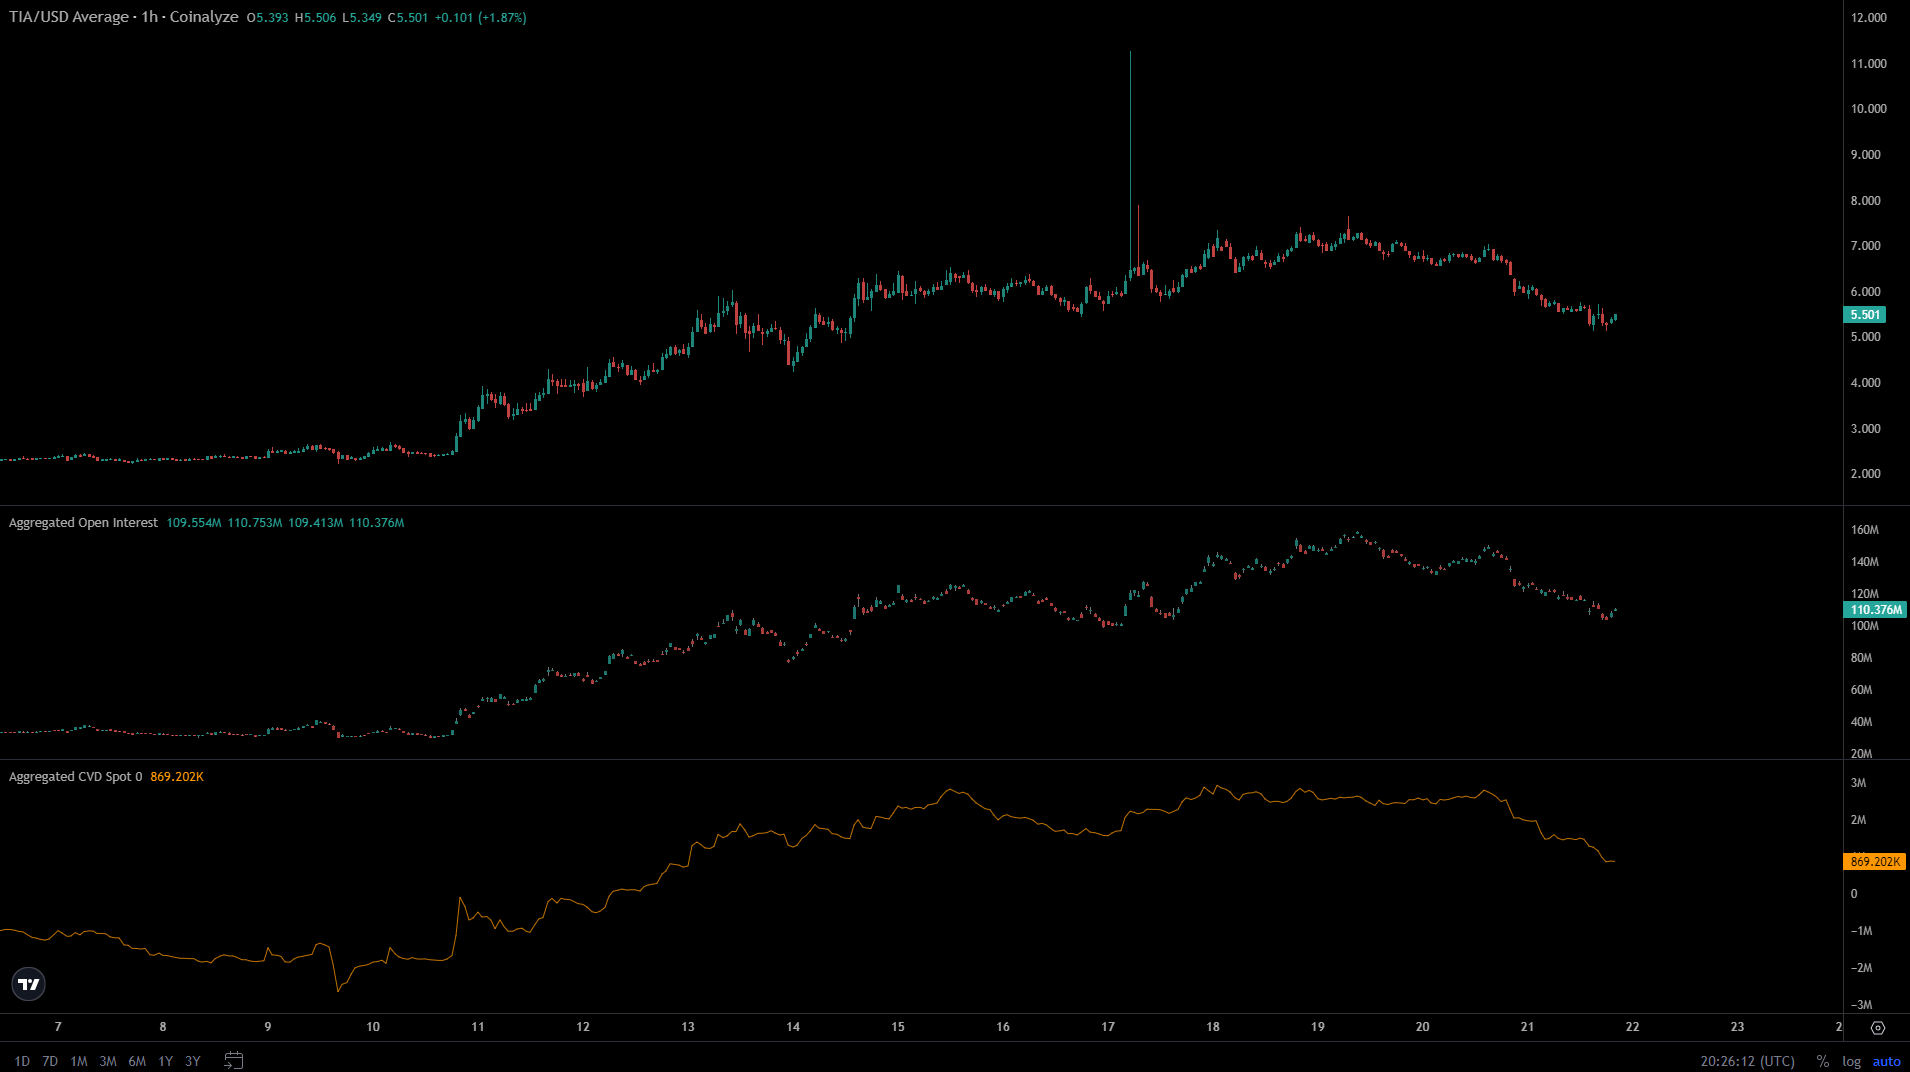
Source: Coinalyze
AMBCrypto’s analysis of the Coinalyze data above reinforced the findings from technical analysis. The Open Interest began to decline on 19th November as TIA floated above the $6.5 level. This was a signal that sentiment had swayed bearishly.
Is your portfolio green? Check the TIA Profit Calculator
On 20th November the token prices descended further and this was accompanied by another drop in OI. Therefore, sentiment remained bearish as prices and OI fell in tandem.
Additionally, the spot CVD has also trended lower over the past 24 hours. Buyers can wait for the spot CVD to flatten and prices to form a short-term range before looking to enter the market again.