- Solana broke its bearish market structure in late January.
- The Solana gains in February could continue till $125.
Solana [SOL] has gained close to 10% in the past ten days and exhibited a bullish market structure. It has also performed consistently as a top Layer-1 (L1) blockchain.
A recent AMBCrypto report highlighted that Solana outmatched its competitors, Ethereum [ETH] and Tron on several key metrics.
This robust performance was seen on the price charts as well. Despite the slump in January, when SOL established a bearish structure and dropped to $79, the buyers were able to force a recovery. How high can this rally go?
The bullish market structure break was followed by steady gains
On the 30th of January, SOL surged past a recent lower high at $103.6. In doing so, it flipped the market structure bullishly (highlighted in green). Since then, the bulls have established the $93-$95 region as a firm support zone.
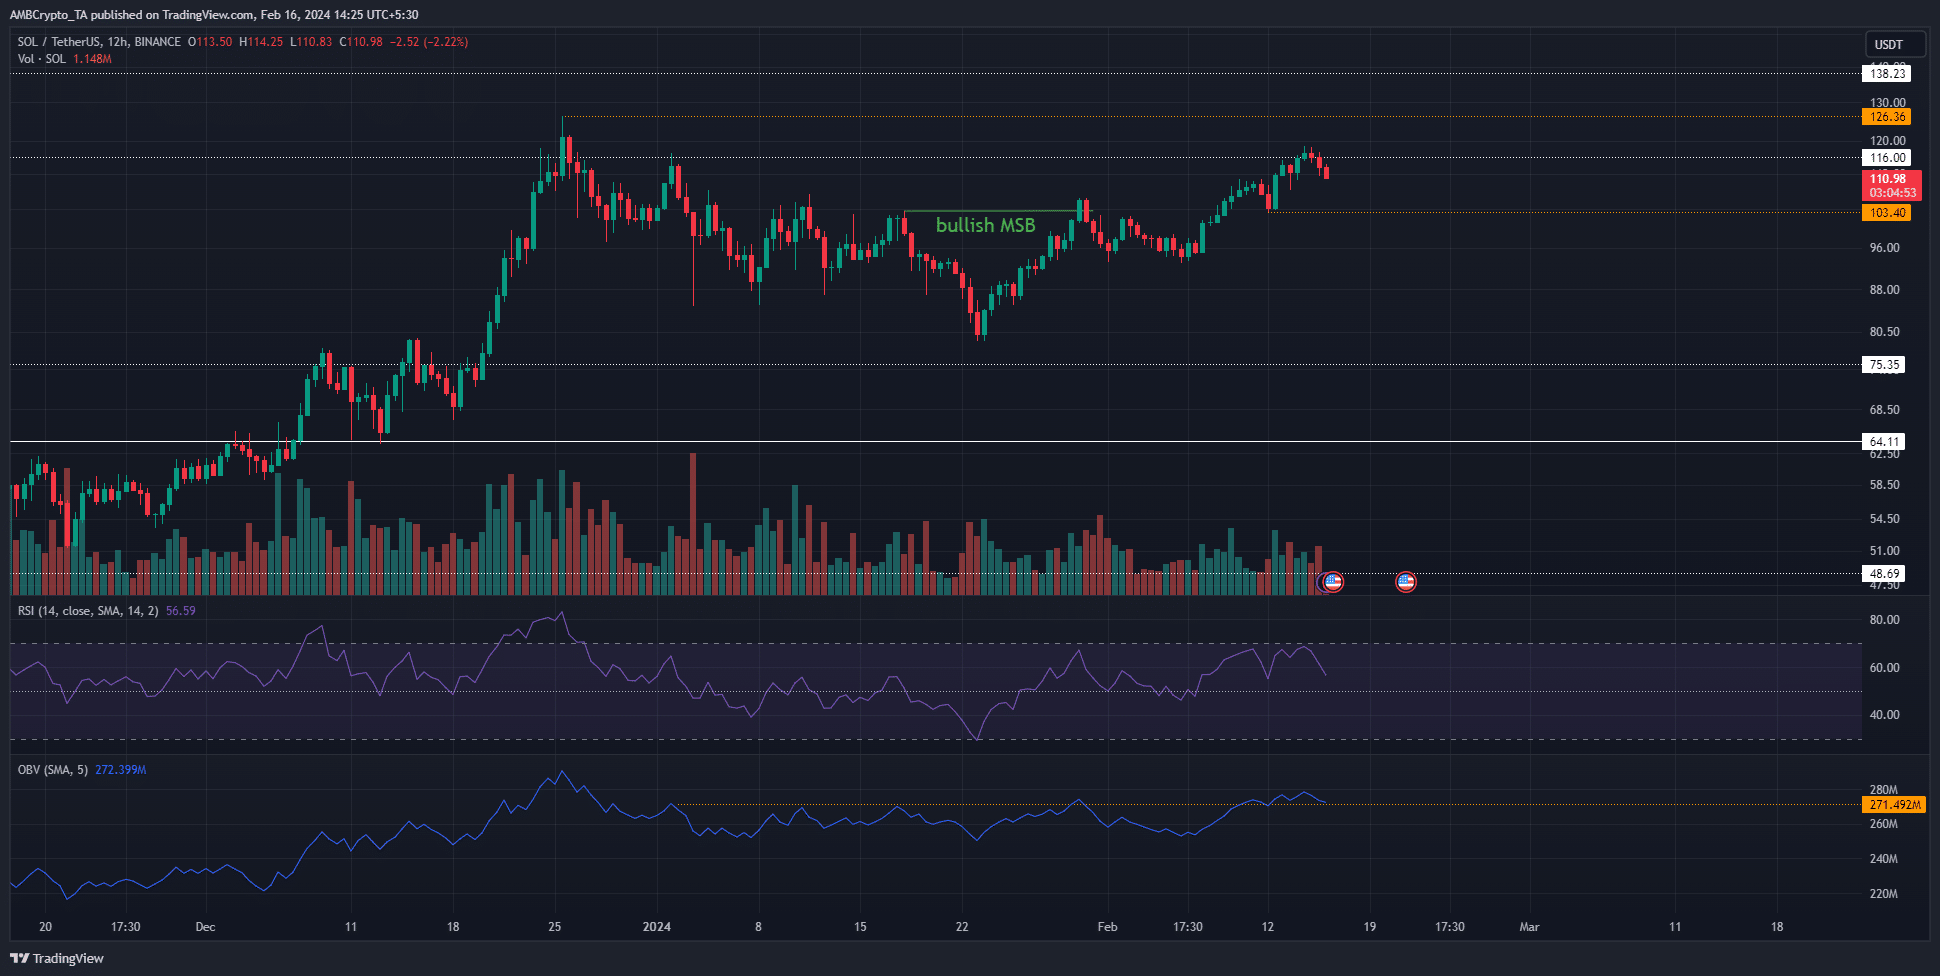
Source: SOL/USDT on TradingView
At press time, the higher low to watch out for was at $103.4. A drop below this would flip the structure bearishly once more. But the technical indicators signaled further gains were likely.
The OBV managed to flip the 2024 local highs, which had been resistance levels over the past two months, to support. This indicated increased buying volume over the past two weeks. Additionally, the RSI was at 56 to reflect bullish momentum on the 12-hour chart.
Together, they reinforced the findings from the price action. To the north, the $126 level was the next target.
Liquidation levels suggested bulls could push prices higher
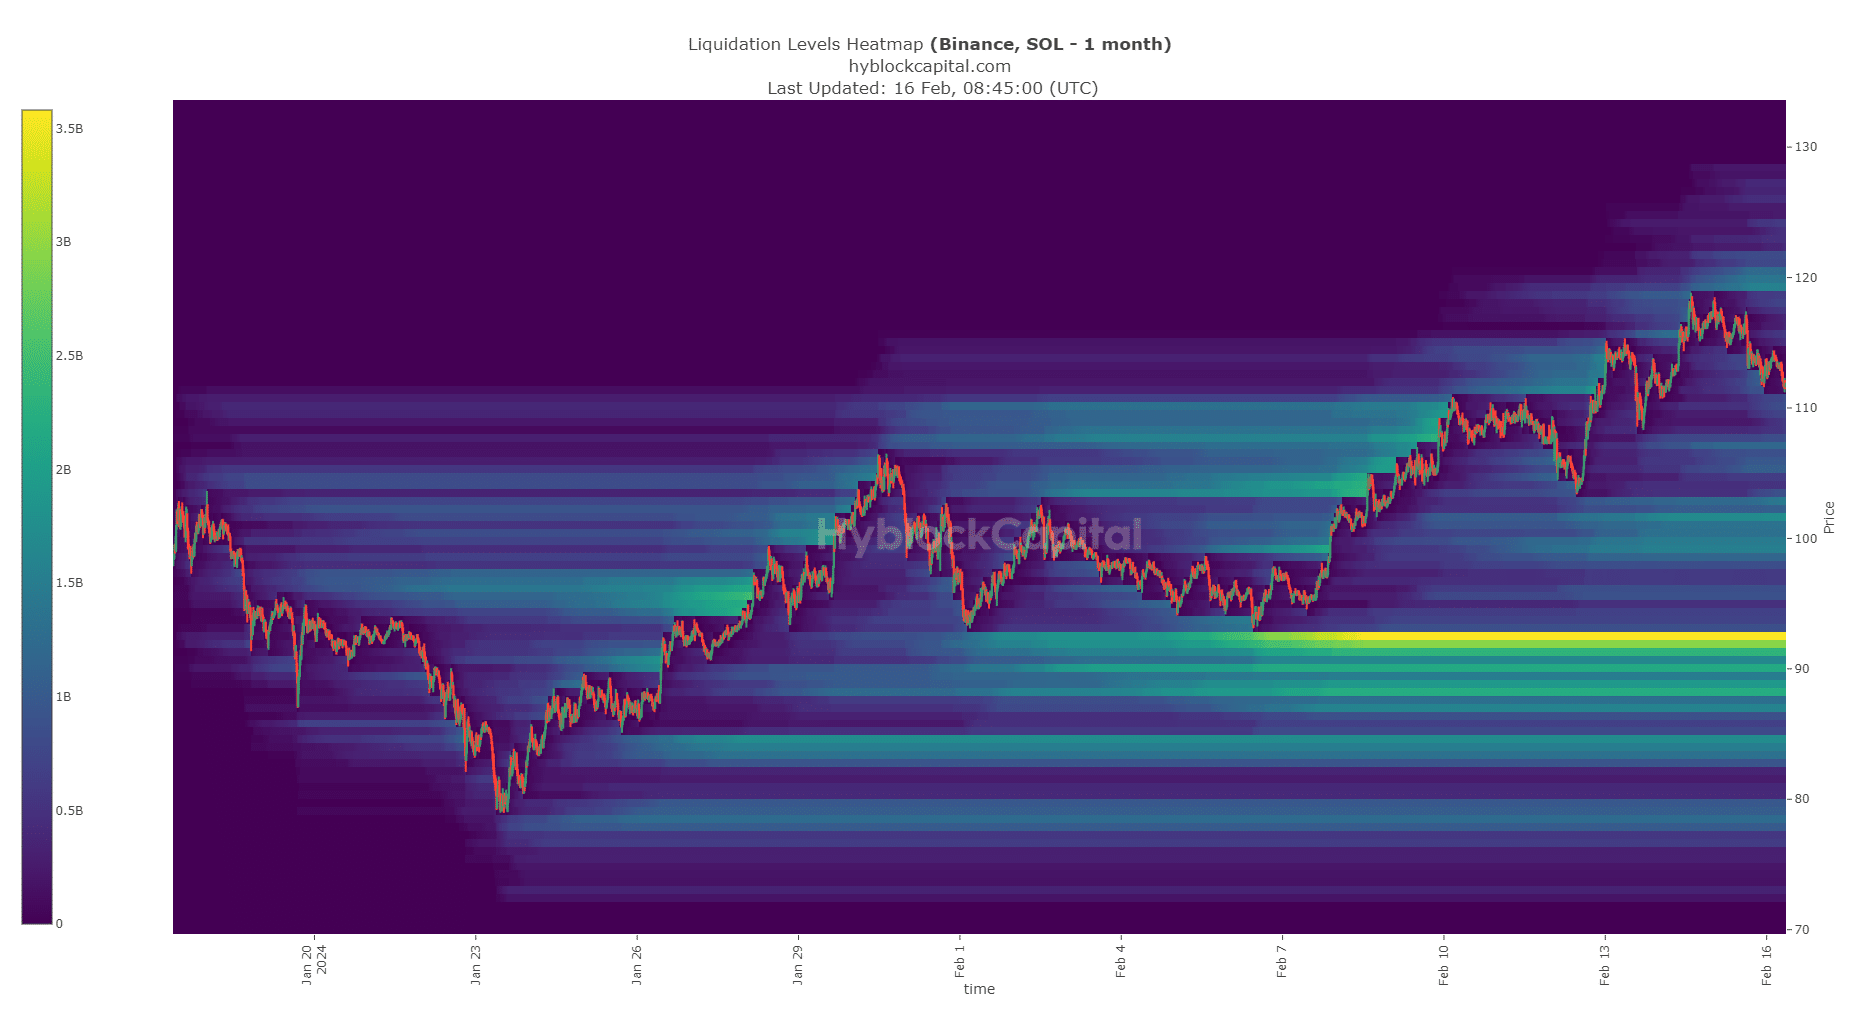
Source: Hyblock
AMBCrypto’s analysis of the Liquidation Levels of the past month showed that the $120 region had a notable amount of levels that could attract prices. On the other hand, the $105-$107 also had a similar amount of liquidation levels.
Is your portfolio green? Check the Solana Profit Calculator
Both were estimated to be in the region of $1.2 billion to $1.5 billion. These two areas of interest could be tested before prices reverse toward the other pocket of liquidity.
Hence, a move to the $120-$125 area would likely present a selling opportunity, while a dip to $105 would offer a buying opportunity.
Disclaimer: The information presented does not constitute financial, investment, trading, or other types of advice and is solely the writer’s opinion.