Stay informed with free updates
Simply sign up to the Global Economy myFT Digest — delivered directly to your inbox.
Interest rates rise. Demand falls. This is what is supposed to happen. Why? Reasons.
One big reason is that housing is just so darn expensive. Buying it involves assuming vast quantities of debt. Higher interest rates mean that highly indebted folk have to divert much of their spending away from whatever they like spending money on, and concentrate instead on just paying the mortgage. Their counterparties – creditors who benefit from higher rates in the form of chunkier interest payments — tend not to be very good at spending. So the economy slows down. That’s (part of) the theory anyway. Fixed-rate mortgages complicate things somewhat, as we’ve discussed previously.
In the IMF’s latest World Economic Outlook, the Fund follows the ECB last year in taking a big sweeping look at the role housing plays in the transmission of monetary policy across the globe.
Despite pretty much everywhere having experienced rising interest rates, a pandemic-induced construction freeze, spiking global construction costs, and weird changes to labour practices like remote working, house prices have behaved very differently. Since the hiking cycle began, around a third of countries have seen house prices fall. Consumption hasn’t been perfectly correlated to house prices, but the Fund reckons the relationship is sufficiently spooky to print this chart, at least implying a strong linear link.
Evolution of House Prices and Consumption in the Postpandemic Tightening Cycle (per cent change)
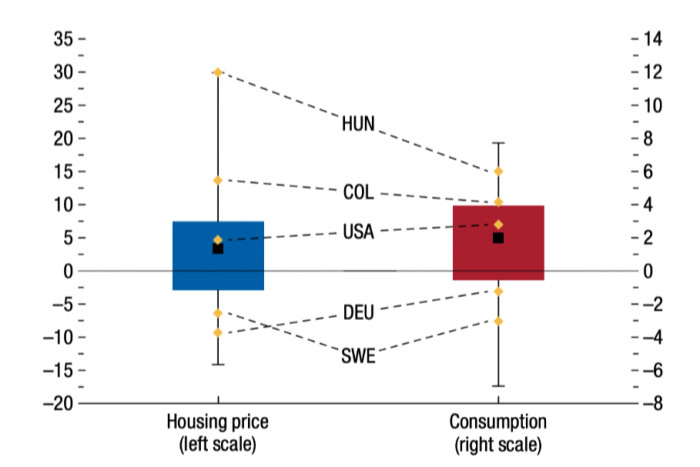
Their bottom line — that countries 1) with households that are more indebted; 2) and more able to borrow large amounts; 3) where it is harder to build more houses; 4) have ‘overvalued’ house prices; and 5) whose interest payments are more sensitive to changes in policy interest rates, will be more sensitive to policy rate changes — is not exactly surprising.
But their view as to where it’s easier to build new houses is likely to trigger millennials across the world. For example, their methodology points to more supply constraints in the United States than in the United Kingdom. This feels odd. And most markets don’t screen as overvalued. So maybe look away now unless you’re Hungarian.
Countries ranked by estimated strength of the housing channel of monetary policy transmission
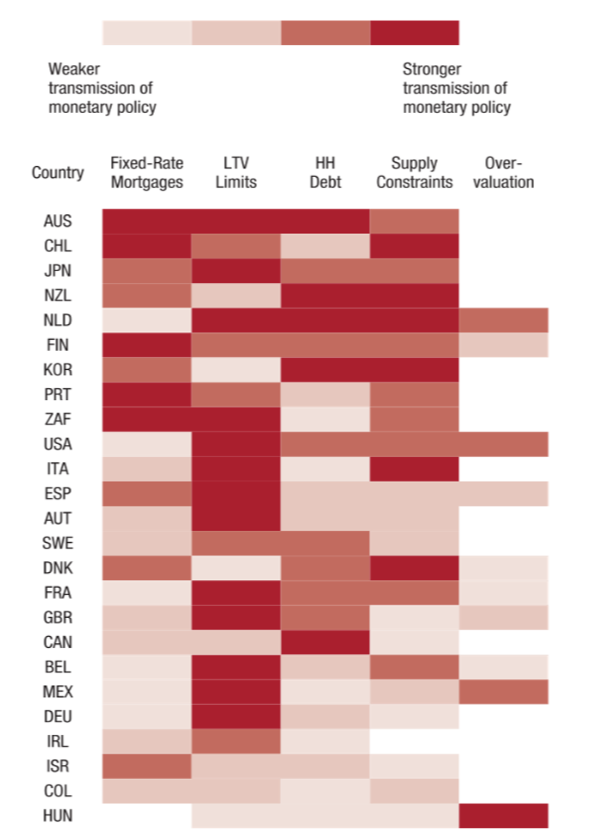
The heatmap shows the IMF’s estimate as to how countries rank in the strength of their housing channels of monetary policy transmission, from strongest to weakest. In their words:
Darker reds depict countries with stronger monetary policy transmission based on the cross-country distribution for each variable, whereas lighter reds indicate the opposite.
Australia’s relative lack of fixed-rate mortgages, high household debt, permissive loan-to-value borrowing limits, and its high share of the population living in supply-restricted areas make it the number one country for housing as a channel of monetary policy. The UK by contrast features way down the list.
The Fund is surely right to get us all a bit more focused on housing’s role in the macroeconomy. Housing is important not only as that thing right down the bottom of Maslow’s hierarchy of needs, but also as one of the single largest asset classes in the world. As the global financial crisis reminded us, banks and non-banks alike are pretty exposed to house price falls — even if they happen on the other side of the world.
To really bring the issue home, the NY Federal Reserve put out a blog at the end of March on the implications for the United States of a hypothetical China property hard landing. They reckon it would take 2 percentage points off US economic growth, 3 percentage points off inflation, cause a 150 basis point rally in two-year Treasury notes and boost the US dollar’s value by 10 per cent.
Chinese property starts, property sales, and real estate investment, 1996-2024

Chinese housing starts have collapsed more than 60 percent from peak. Property firms have been defaulting left right and centre. New lending for property-related activity is contracting. We’re not Chinese property experts, but whatever landing the property sector is experiencing doesn’t exactly look soft.
China doesn’t feature in the IMF’s heatmap. But it does get a special focus section at the end of the chapter. Unfortunately for folks worrying about a Chinese property hard landing, their verdict is that “the transmission from policy rates to the real economy through the housing market has been weak”.
We guess the message of this post is that despite the deglobalisation freight train, the world is still an interconnected place. And that while the housing channel to monetary policy transmission might very well help central bankers achieve their goals, it probably won’t help China this time around.