- Ethereum options trading volume has rallied to an all-time high in January.
- The coin has seen a decline in open interest in its futures market.
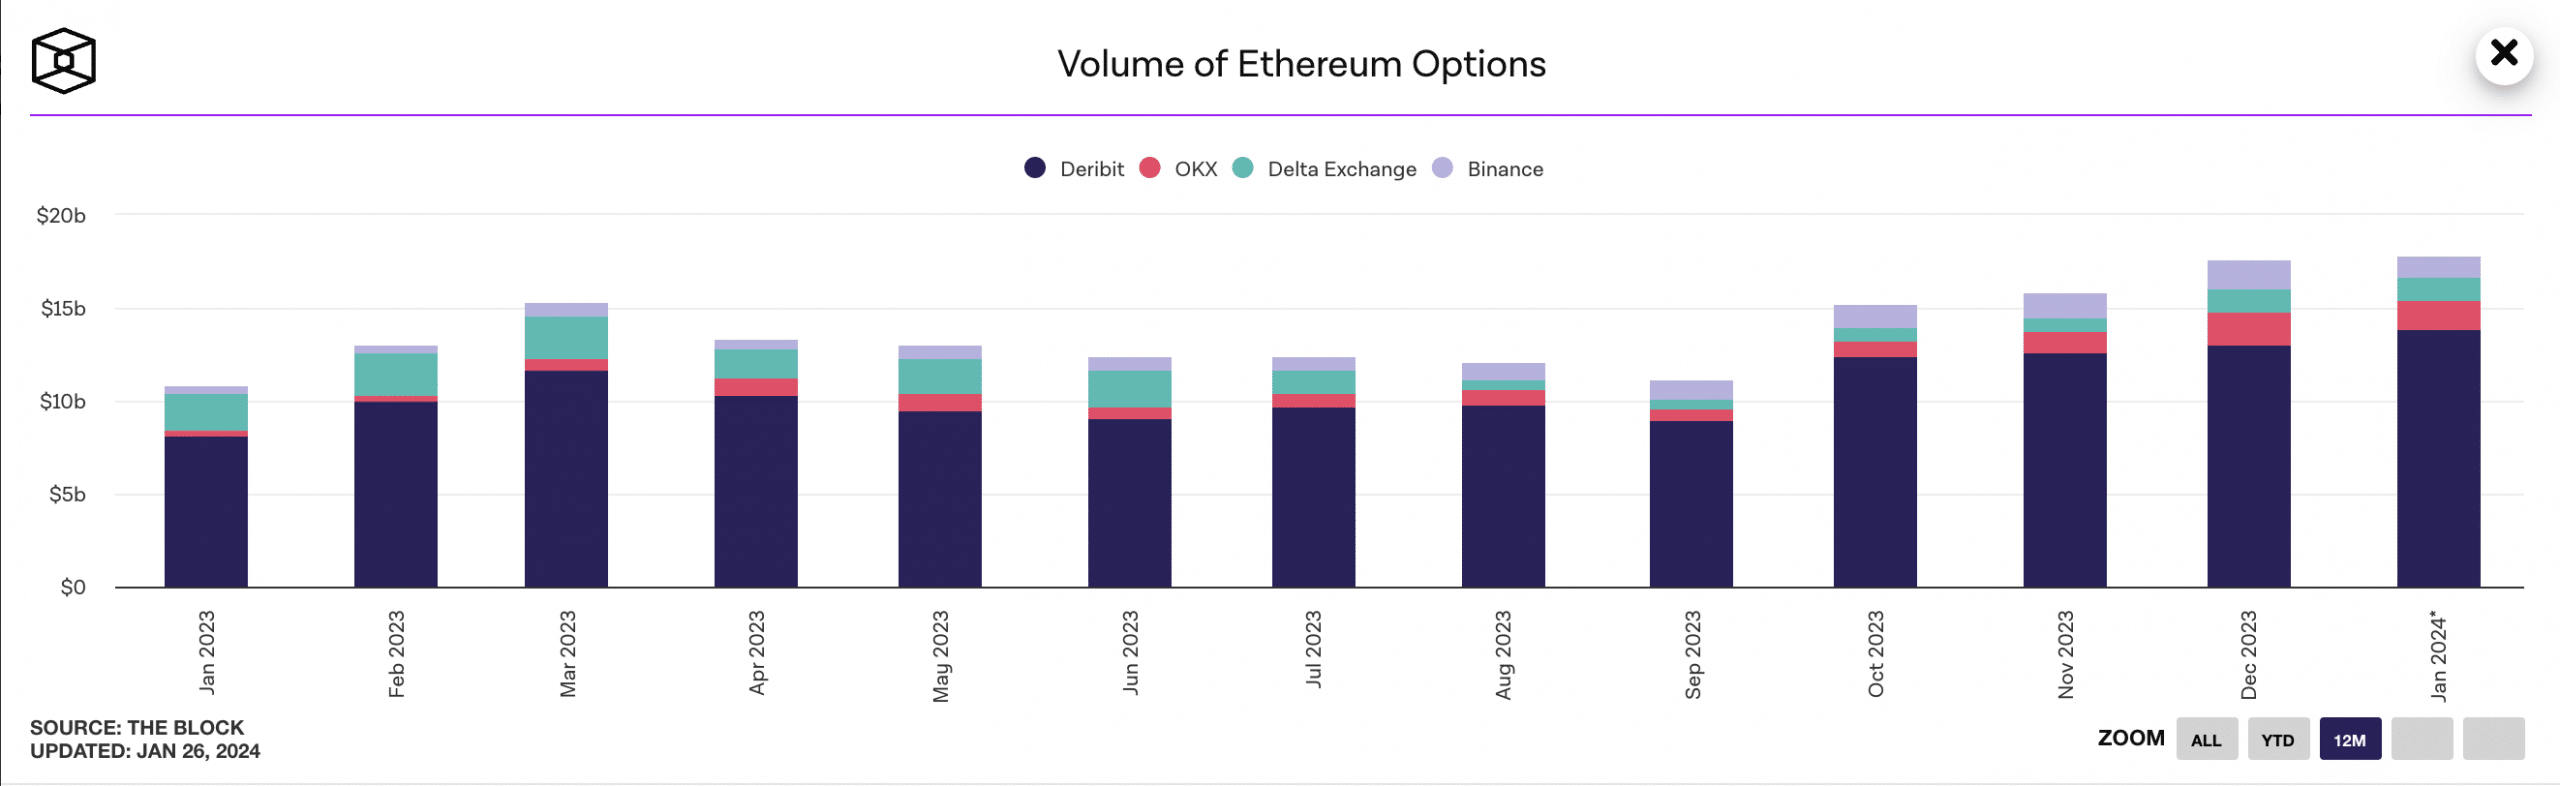
With $17.9 billion recorded so far this month, Ethereum [ETH] options trading volume has skyrocketed to an all-time high, according to The Block Data dashboard.
This represents a 2% uptick from the $17.7 billion recorded in trading volume in the coin’s options market in December.
Source: The Block
An assessment of the coin’s put-call ratio showed that a significant amount of the 932,000 Ether options contracts that expired on the 26th of January were bets in favor of a price rally.
In a recent post on X (formerly Twitter), GreeksLive noted that Ethereum options open interest had a put-call ratio of 0.31 prior to the expiry of the options contracts.
An asset’s put-call ratio measures market sentiment regarding that asset. It does this by dividing the number of outstanding put options (bets on the price falling) by the number of outstanding call options (bets on the price rising).
With a put-call ratio of 0.31, it means that for every 100 ETH call options purchased, only 31 put options were bought. This showed that participants in ETH’s derivatives market expected its price to rise or at least hold steady near expiration.
Jan. 26 Options Data
94,000 BTC options are about to expire with a Put Call Ratio of 0.51, a Maxpain point of $41,000 and a notional value of $3.75 billion.
932,000 ETH options are about to expire with a Put Call Ratio of 0.31, Maxpain point of $2,300 and notional value of $2.07… pic.twitter.com/EifV6kgUBz— Greeks.live (@GreeksLive) January 26, 2024
ETH’s futures market
In the coin’s futures market, the approach adopted by traders differs. AMBCrypto found that ETH’s futures open interest has declined 11% since the 17th of January. It fell from $8.7 billion to $7 billion at press time, according to data from Coinglass.
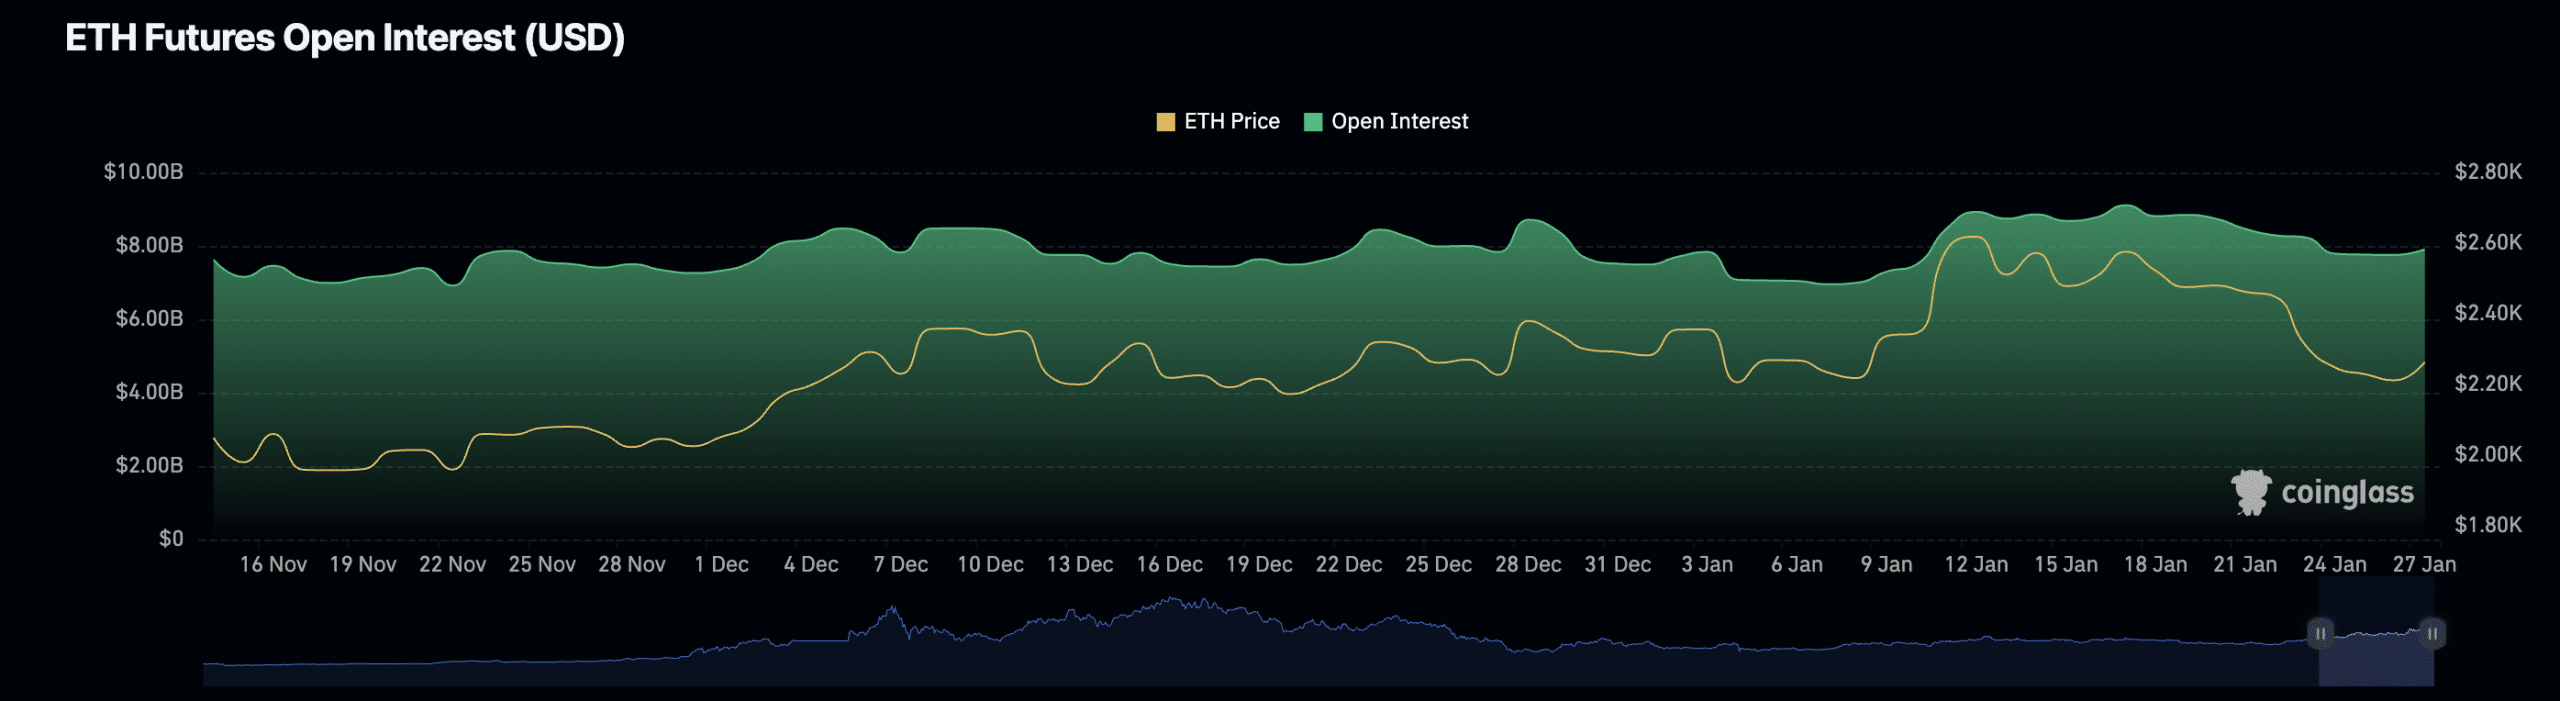
Source: Coinglass
When an asset’s open interest drops in this manner, it suggests that fewer new futures contracts are being opened due to declining price volatility, waning positive sentiment, or traders simply closing existing positions without opening new ones.
An assessment of some volatility markers confirmed the decline in price swings since the middle of the month.
For example, ETH’s Average True Range (ATR) – which measures market volatility by calculating the average range between high and low prices over a specified number of periods – was spotted at 100.50 at press time. It has dropped by 15% since the 13th of January.
Is your portfolio green? Check out the ETH Profit Calculator
When ATR witnesses a decline, it suggests that the price swings are becoming less significant. In a similar trend, the coin’s Chaikin Volatility has declined by 160% within the same period.

Source: TradingView
This indicator also measures price volatility by tracking the difference between an asset’s high and low prices over a specified period. When it declines, volatility is low.