- Solana hiked for the third day as it traded above $29, at press time
- Despite the same, negative funding rates dominated the derivative side of the market
Solana [SOL] has been capturing the imagination of market observers, not solely due to its northbound trajectory but also for the way it boldly charted its course away from the market’s traditional rhythms. As this upbeat trend unfolds, two crucial metrics are now broadcasting distinct signals for SOL.
– How much are 1,10,100 SOLs worth today
Solana’s streak continues
Solana’s daily timeframe chart revealed an impressive 3-day winning streak, with the most modest gains clocking in at a remarkable 6%. At the time of writing, the ascent had extended beyond 8%, propelling SOL’s trading price past the $29-mark.
The magnitude of this price hike was further underscored by the Relative Strength Index (RSI), with the same comfortably above 80, firmly in the overbought territory at press time. This existing RSI status served as an enlightening reference point and will illuminate subsequent key metrics.

Source: TradingView
Solana’s TVL grows silently
Initially, the Total Value Locked (TVL) for Solana seemed to maintain a steady course, as per DefiLlama. And yet, upon a more meticulous examination, a significant shift came into focus. Towards the dawn of the year, the TVL stood at approximately $217 million. However, at the time of this update, it had surged beyond $344 million.
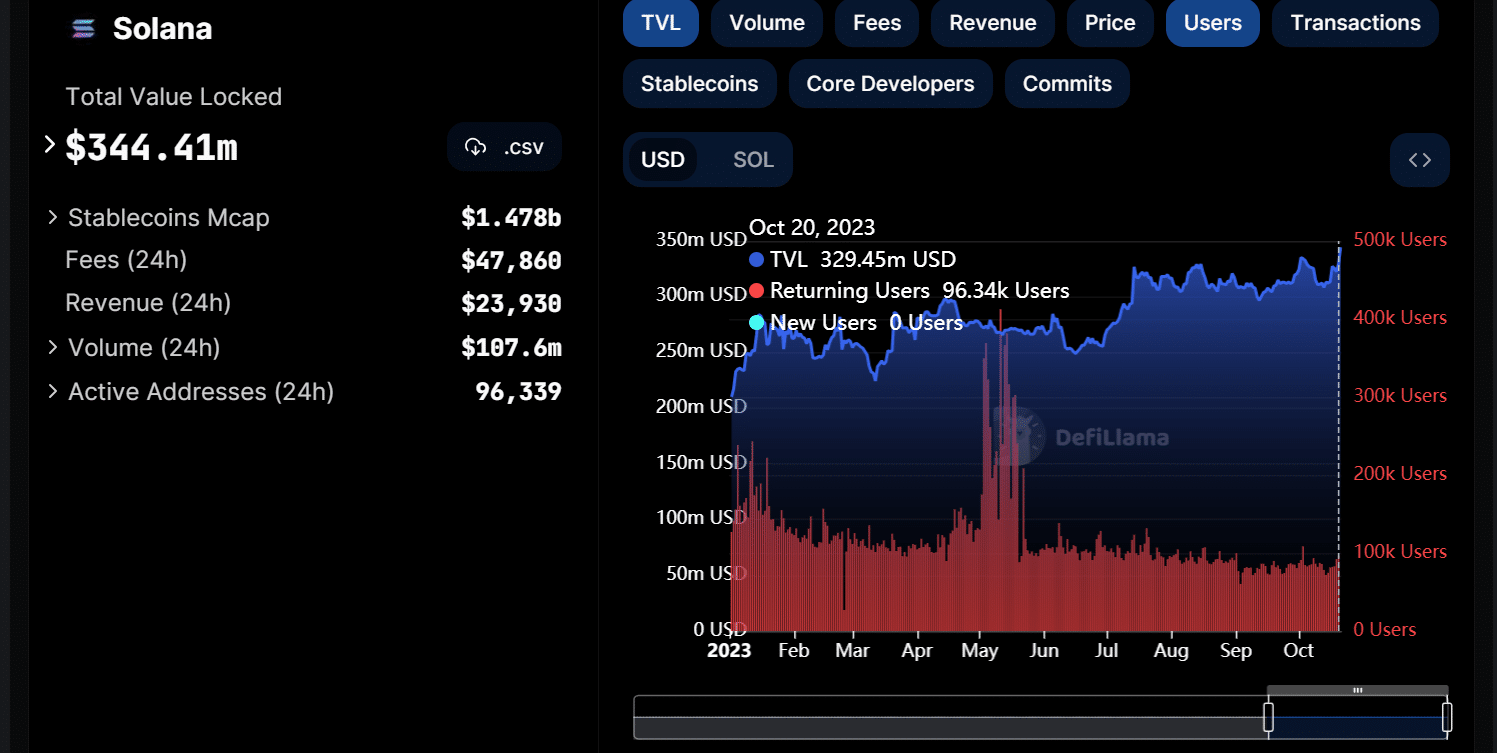
Source: DefiLlama
This expansion highlighted the significant growth the network has seen over the past 10 months. It also suggested that the ecosystem has expanded in tandem with its assets. However, the market sentiment told a different tale.
Traders take a polarising stand
Coinglass’s analysis revealed an intriguing paradox – Despite the recent surge in Solana’s price, the market hasn’t responded in kind. The funding rate chart painted a telling picture, illustrating that this spike has triggered a surge in negative funding rates. Notably, the negative funding rate observed on 20 October marked Solana’s highest level in the last three months.
Is your portfolio green? Check out the Solana Profit Calculator
Furthermore, as of press time, the negative funding rate had slightly receded but still hovered around 0.0084%. This market position may well be attributed to the RSI’s own positioning. With the RSI now dwelling in the overbought territory, it may be a sign of an impending price downturn.