On July 12th, Composable Finance, a cross-chain interoperability platform announced Centauri, the first IBC connection between Cosmos and Polkadot. IBC is a protocol that allows different blockchains to communicate and exchange data and assets.
Centauri connects Cosmos Hub, the main blockchain of Cosmos, with Rococo, a testnet for Polkadot parachains. The announcement also included instructions on how to participate and use Centauri.
Moreover, this was a piece of positive news for Cosmos coin (ATOM) as it demonstrated how Cosmos can collaborate with other major blockchain platforms, such as Polkadot, and use IBC to enable cross-chain applications and services.
the coin skyrocketed immediately after Cosmos announced Centauri rising by roughly 12% swiftly within two weeks and reached from $9 to $10.
Cosmos coin surged 12.67% in market value and 164.10% in trading volume in the last 24 hours, per Coinmarketcap which is a crypto data and info website. Its market value is $3,527,524,524 and its trading volume is $166,433,295. There are 346,608,690 ATOM in circulation.
Cosmos coin open interest is $82.81 Million, as per Coinglass, and it rose by 12.70% in the last day. The long versus short ratio for 24 hours is 0.9972. The average volume of Cosmos coin increased by 179.52%, and it is at $333.04 Million now.
The coin did well this month as it climbed 17.28%. However, the ATOM price dropped by 18.83% in the past six months, showing poor performance. Also, the year-to-date return of the ATOM price is negative with an 18.83% decline.
Cosmos Price Technical Analysis in 1-D Timeframe
The ATOM price has been in a downtrend for five months from February to June, falling from $15 to $8, a 47% decline. Cosmos price made lower highs and lows during this period. From the $8.19 support level, the price started an uptrend since June 10, making higher highs and lows. It increased by 27% and is trading at $10.22 at the time of writing.
However, the previous price pattern shows that the price was in a downtrend and bounced off the trendline several times. This indicates that the price may be forming an ascending broadening wedge pattern, which is a bearish sign. This means that the price may drop in the long term after completing the pattern.
Moreover, the price may rise to the next resistance levels in the short term, but it will need more buyers to overcome them. Therefore, the coin must attract more demand to continue its upward momentum
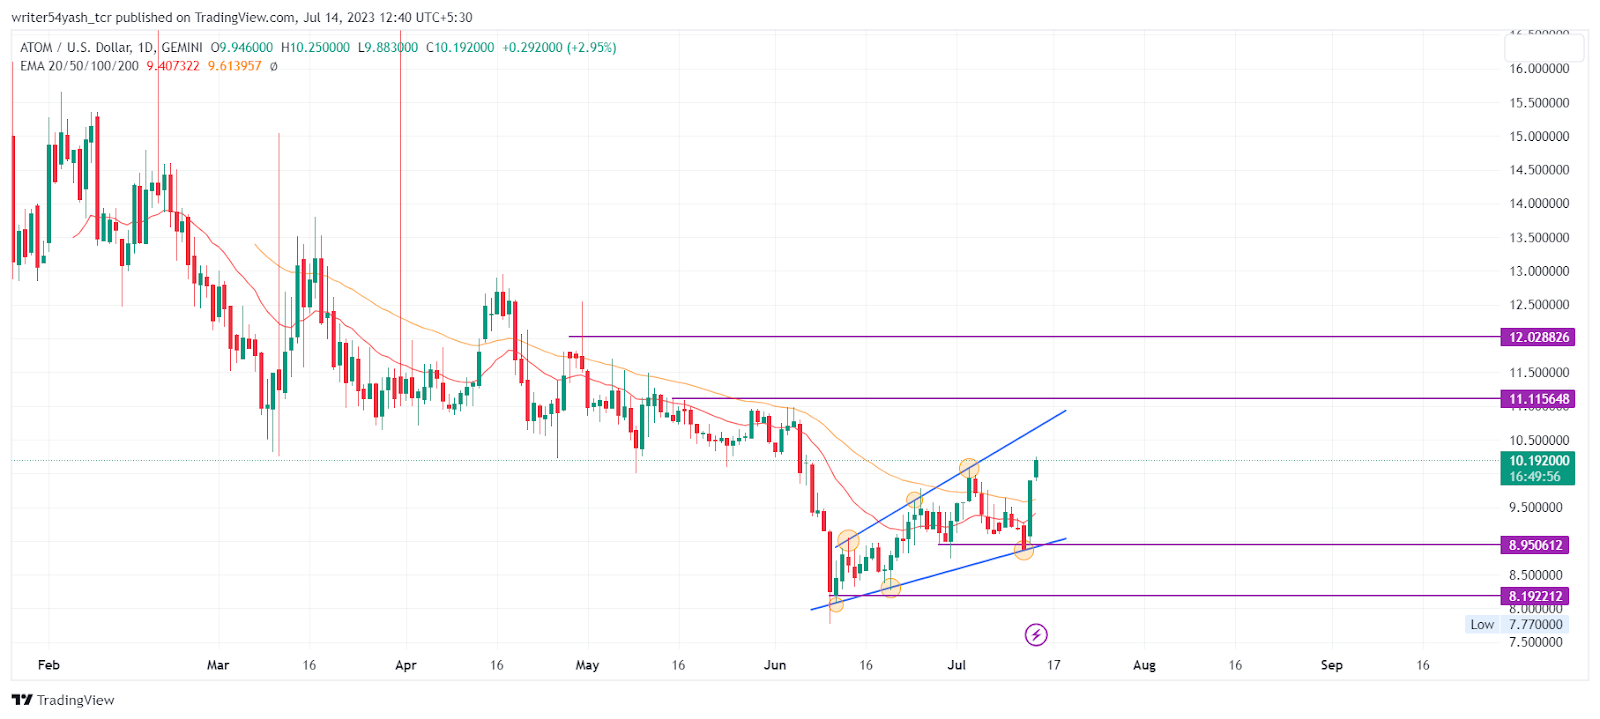
The Cosmos coin price (ATOM) is above the 20 and 50-day EMAs (exponential moving averages). The EMAs are acting as supports pushing the price trend up. Therefore, the coin is likely to move higher, giving bullish signals on the daily time frame chart.
As per the Cosmos price prediction, the MACD line at 0.056326 and the signal line at -0.023203 are above the zero line, a bullish crossover is observed highlighting a bullishness for the coin. The current value of RSI is 61.11 points, and the 14 SMA is at the median line at 51.18 points. Hence, the Cosmos price prediction suggests the coin price is bullish.

Conclusion
The ATOM coin has a bullish sentiment in the 1-D time frame. The price action shows a bullish outlook at the time of publishing. The technical parameters of the Cosmos price also support the bullish trend. The major indicators MACD, RSI, and EMA are giving positive signals and imply that the uptrend may continue in the short term.
Technical Levels:
- The nearest support: $8.19 and $8.95.
- The closest resistance: $11.11 and $12.02.
Disclaimer
In this article, the views and opinions stated by the author or any people named are for informational purposes only, and they don’t establish the investment, financial, or any other advice. Trading or investing in cryptocurrency assets comes with a risk of financial loss.